Victor Mandela
  • Front Page
  • Live Demos
  • Case Study
  • Dispatches
  • About
  • Training
    • Available courses
    • Upcoming courses
    • Testimonies & awards
  • Resources
    • More dashboards (embedded)
    • Gallery
    • Books & guides
    • Contact
  • Hire Me
Open to roles & consulting · M&E · Impact Evaluation · Agricultural Analytics · R Shiny LinkedInGitHubEmailBook a call
THE Evidence & Impact Review — Monitoring, Evaluation & Decision Analytics Edited by Victor Mandela · MEL & Data Science Consultant Nº 2026·11
Victor Mandela, M&E and data science consultant
This edition 8 live dashboards you can open and test right now Try the demosHire me
Portfolio Edition ••• Monitoring & Evaluation · Impact Evaluation · R Shiny Decision Support ••• Nairobi, KenyaUPDATED NOV 2026

Victor Mandela | M&E, Impact Evaluation & R Shiny Dashboard Consultant

Monitoring and Evaluation and impact evaluation consultant in Nairobi, Kenya. Live R Shiny decision-support dashboards for agriculture, health, food security and development programmes.
THIS EDITION
Soil pH, not fertiliser, was the biggest maize yield driver across Rwanda trials Split urea at V6+V10 hits 7.45 t/ha in the Eastern Savannah Treatment differences significant in 4 of 5 mega-environments Yield model: R² 0.623, RMSE 1.24 t/ha — and what that does and doesn't justify Not a data shortage — a data integration problem 8 live R Shiny dashboards you can test today Now taking M&E, impact evaluation and dashboard engagements
8live R Shiny dashboards — open them, filter them, test them
600+agricultural trial locations integrated with soil & rainfall data
M&Eframeworks, impact evaluation & RCT design for programmes
40+technical dispatches on R, surveys, GIS, DHS & evaluation
Lead story · Agricultural analytics · Live demo

Soil pH — not fertiliser — was the biggest driver of maize yield across 600+ Rwandan trials

I built an R Shiny decision-support tool that compares four urea rate/timing combinations across five mega-environments, districts and seasons — joining field-trial data with SoilGrids soil and CHIRPS rainfall. Soil pH carried about 42% of variable importance; urea treatment 28%; district 18%.

Split urea at V6+V10 gave the best observed yield in the Eastern Savannah, 7.45 t/ha. Treatment differences were significant in 4 of 5 environments, and the yield model (R² 0.623, RMSE 1.24 t/ha) was assessed honestly: good for ranking strategies, not for promising a farmer a number.

FULL CASE STUDY › Rwanda Maize Yield Analyzer: soil pH 42%, urea 28%, district 18% of variable importance; 7.45 t/ha best yield; R² 0.623
▶ Launch the live dashboard Read the case study Login: test / test
Who I am · 30-second read
Victor Mandela

Victor Mandela

Monitoring, Evaluation & Data Science Consultant · Nairobi, Kenya
  • Impact evaluation & M&E — frameworks, indicators, RCT and quasi-experimental design
  • Decision-support tools — R Shiny dashboards with live statistics, maps and prediction
  • Data integration — survey, programme, soil, climate & GIS data joined into one view
  • Field data systems — KoboToolbox, SurveyCTO, ODK, DHS; teams trained across countries
Hire meBook 15 minFull profileLinkedIn
Live demo index · 8 apps
  1. Rwanda Maize Yield AnalyzerAgricultural analytics
  2. Land-Restoration Baseline DashboardEnvironment & livelihoods M&E
  3. Analytics Monitoring DashboardResearch operations · CSV Research
  4. ELMA EJAF Adolescent HealthGlobal health M&E
  5. Food Security & Nutrition — Lebanon 2024Humanitarian response
  6. Multidimensional Poverty Index by RegionSocial policy
  7. Donor Fund Stream in KenyaDevelopment finance & accountability
  8. Medicine Demand ForecastingHealth supply chain
Live demos8 dashboards: agriculture, health, food security, povertyTRY ›
Case studyThe maize yield analyzer, told in 10 short partsREAD ›
M&E deskFrameworks, monitoring plans, evaluation designREAD ›
Field dataKoboToolbox & SurveyCTO quality systemsREAD ›
Work with meDashboards in 2–4 weeks · evaluations · trainingHIRE ›
Live Demos Desk — open & testAll dashboards ›
Rwanda Maize Yield Analyzer — dashboard screenshotLIVE DEMO
Agricultural analytics

Rwanda Maize Yield Analyzer

Optimal urea rate/timing by environment, yield drivers, an honestly-assessed yield model and 600+ mapped trial locations.

R Shiny modules · ANOVA/Tukey · Leaflet · SoilGrids · CHIRPS
Demo login · username test · password test
Launch live demo ›Case notes
1,628 households11 modules · mapping · disaggregation · downloadable tablesLIVE DEMO
Environment & livelihoods M&E

Land-Restoration Baseline Dashboard

Baseline survey of 1,628 households turned into an 11-module dashboard with maps, disaggregation and downloadable tables.

R Shiny · Leaflet · survey analysis
Demo login · username test · password test
Launch live demo ›
Analytics Monitoring Dashboard — dashboard screenshotLIVE DEMO
Research operations · CSV Research

Analytics Monitoring Dashboard

Real-time KPI tracking during data collection: completion rates, data-quality flags and daily enrolment across sites.

R Shiny · tidyverse · plotly · DT
Launch live demo ›Case notes
ELMA EJAF Adolescent Health — dashboard screenshotLIVE DEMO
Global health M&E

ELMA EJAF Adolescent Health

HIV testing, PrEP uptake, SRH services and mental-health indicators for adolescents aged 10–24 across programme sites.

R Shiny · leaflet · plotly · highcharter
Launch live demo ›Case notes
Food Security & Nutrition — Lebanon 2024 — dashboard screenshotLIVE DEMO
Humanitarian response

Food Security & Nutrition — Lebanon 2024

IPC classification, Food Consumption Score and livelihood indicators to target food assistance faster.

R Shiny · leaflet · plotly · DT
Launch live demo ›Case notes
MPI · KenyaEducation · health · living standards, by regionLIVE DEMO
Social policy

Multidimensional Poverty Index by Region

Poverty disaggregated into education, health and living-standard dimensions to target interventions beyond income.

R Shiny · survey data
Launch live demo ›Case notes
Donor fundsBy funder · county · sectorLIVE DEMO
Development finance & accountability

Donor Fund Stream in Kenya

How donor funds flow across Kenya's counties and sectors — spot under-funded areas at a glance.

R Shiny · interactive maps
Launch live demo ›Case notes
Medicine demandCounty distribution · weekly/monthly/yearly forecastsLIVE DEMO
Health supply chain

Medicine Demand Forecasting

Medicine demand by county, product and package, with weekly, monthly or yearly quantity predictions.

R Shiny · forecasting
Launch live demo ›Case notes
The Maize Yield Case Study · 10-part seriesAll 10 parts ›
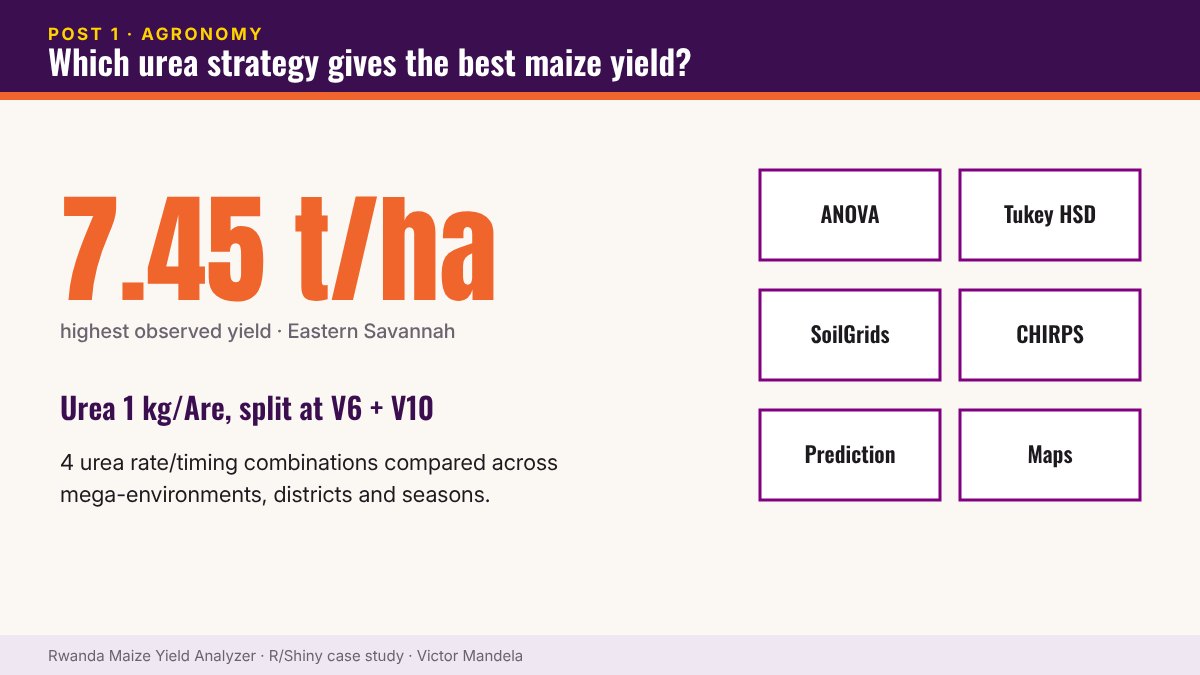
Which urea strategy gives farmers the best maize yields? — infographic PART 1Maize Case Study

Which urea strategy gives farmers the best maize yields?

Comparing four urea rate/timing combinations across Rwanda’s mega-environments, districts and seasons — and why fertiliser recommendations must be location-specific.

4 Sept 2026
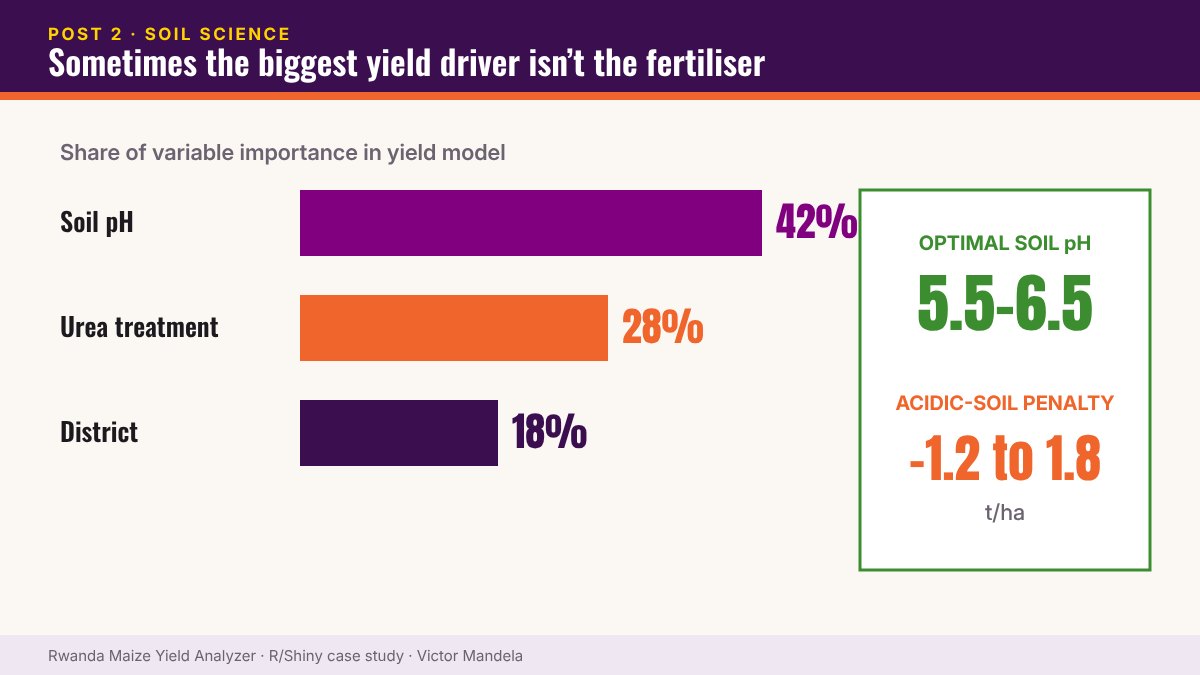
Sometimes the biggest maize yield driver isn't the fertiliser — infographic PART 2Maize Case Study

Sometimes the biggest maize yield driver isn’t the fertiliser

Soil pH accounted for roughly 42% of variable importance in a Rwanda maize yield analysis — ahead of urea treatment (28%) and district (18%).

7 Sept 2026
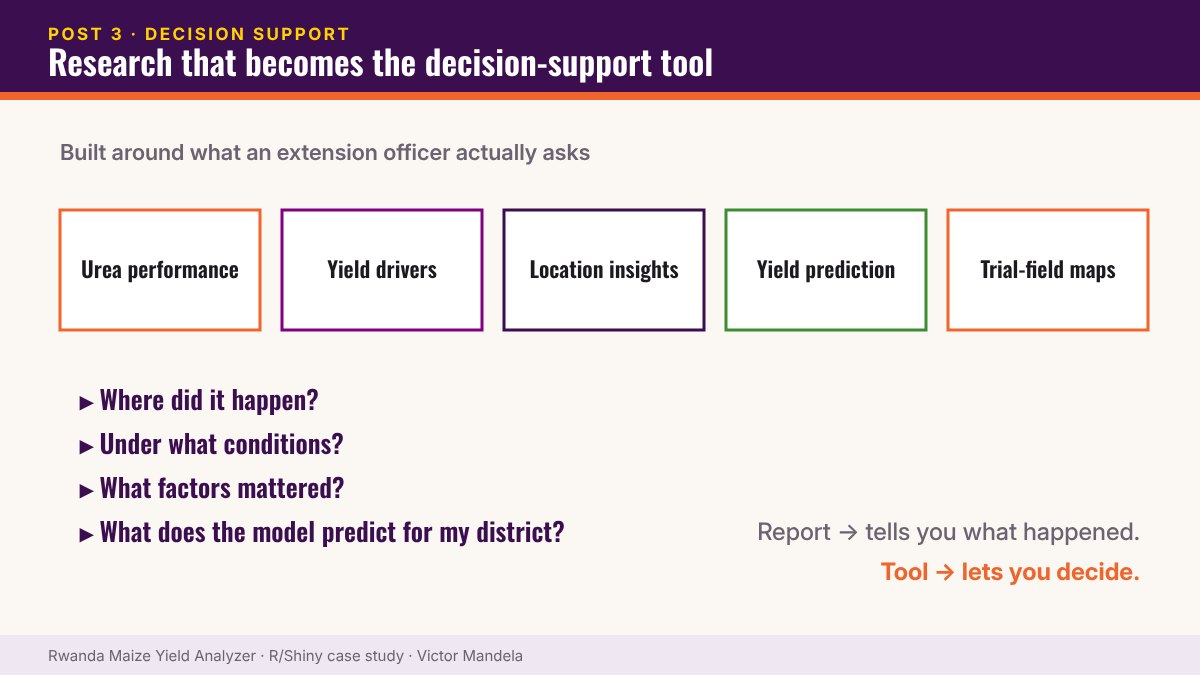
What if agricultural research became the decision-support tool itself? — infographic PART 3Maize Case Study

What if agricultural research became the decision-support tool itself?

Turning maize trial research into an interactive R Shiny decision-support application built around the questions extension officers actually ask.

9 Sept 2026
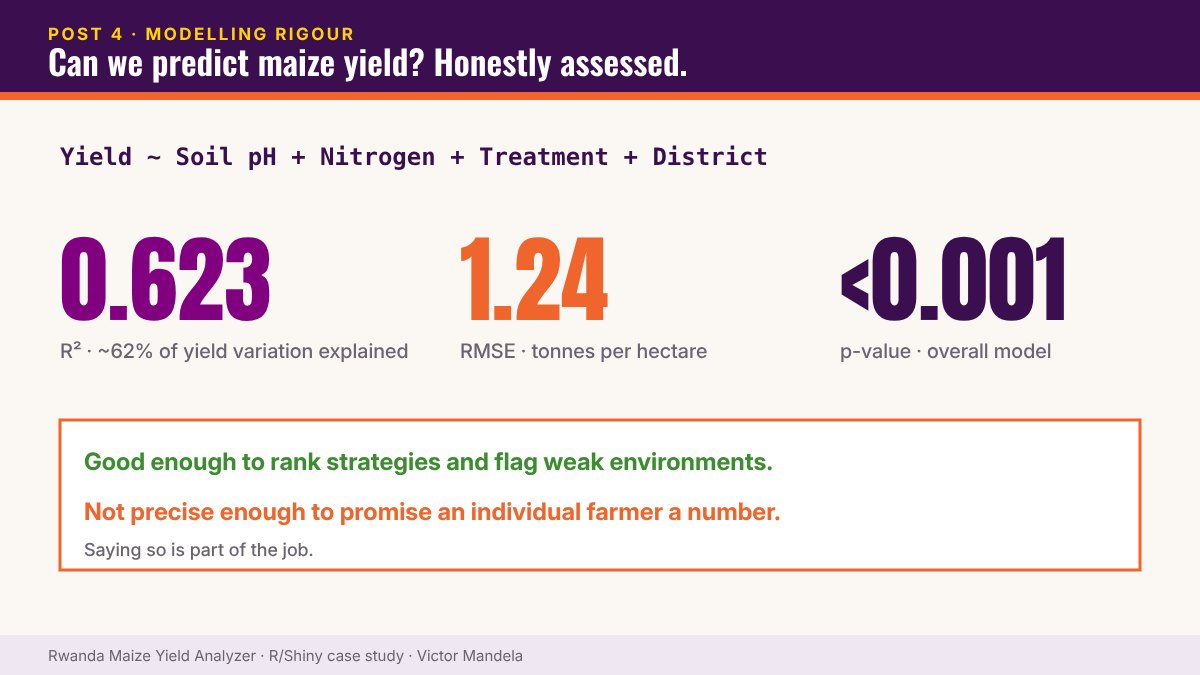
Can we predict maize yield from soil, treatment and location? — infographic PART 4Maize Case Study

Can we predict maize yield from soil, treatment and location?

A linear yield model with R² = 0.623 and RMSE = 1.24 t/ha — and why statistical significance alone doesn’t make a good prediction tool.

11 Sept 2026
No matching items
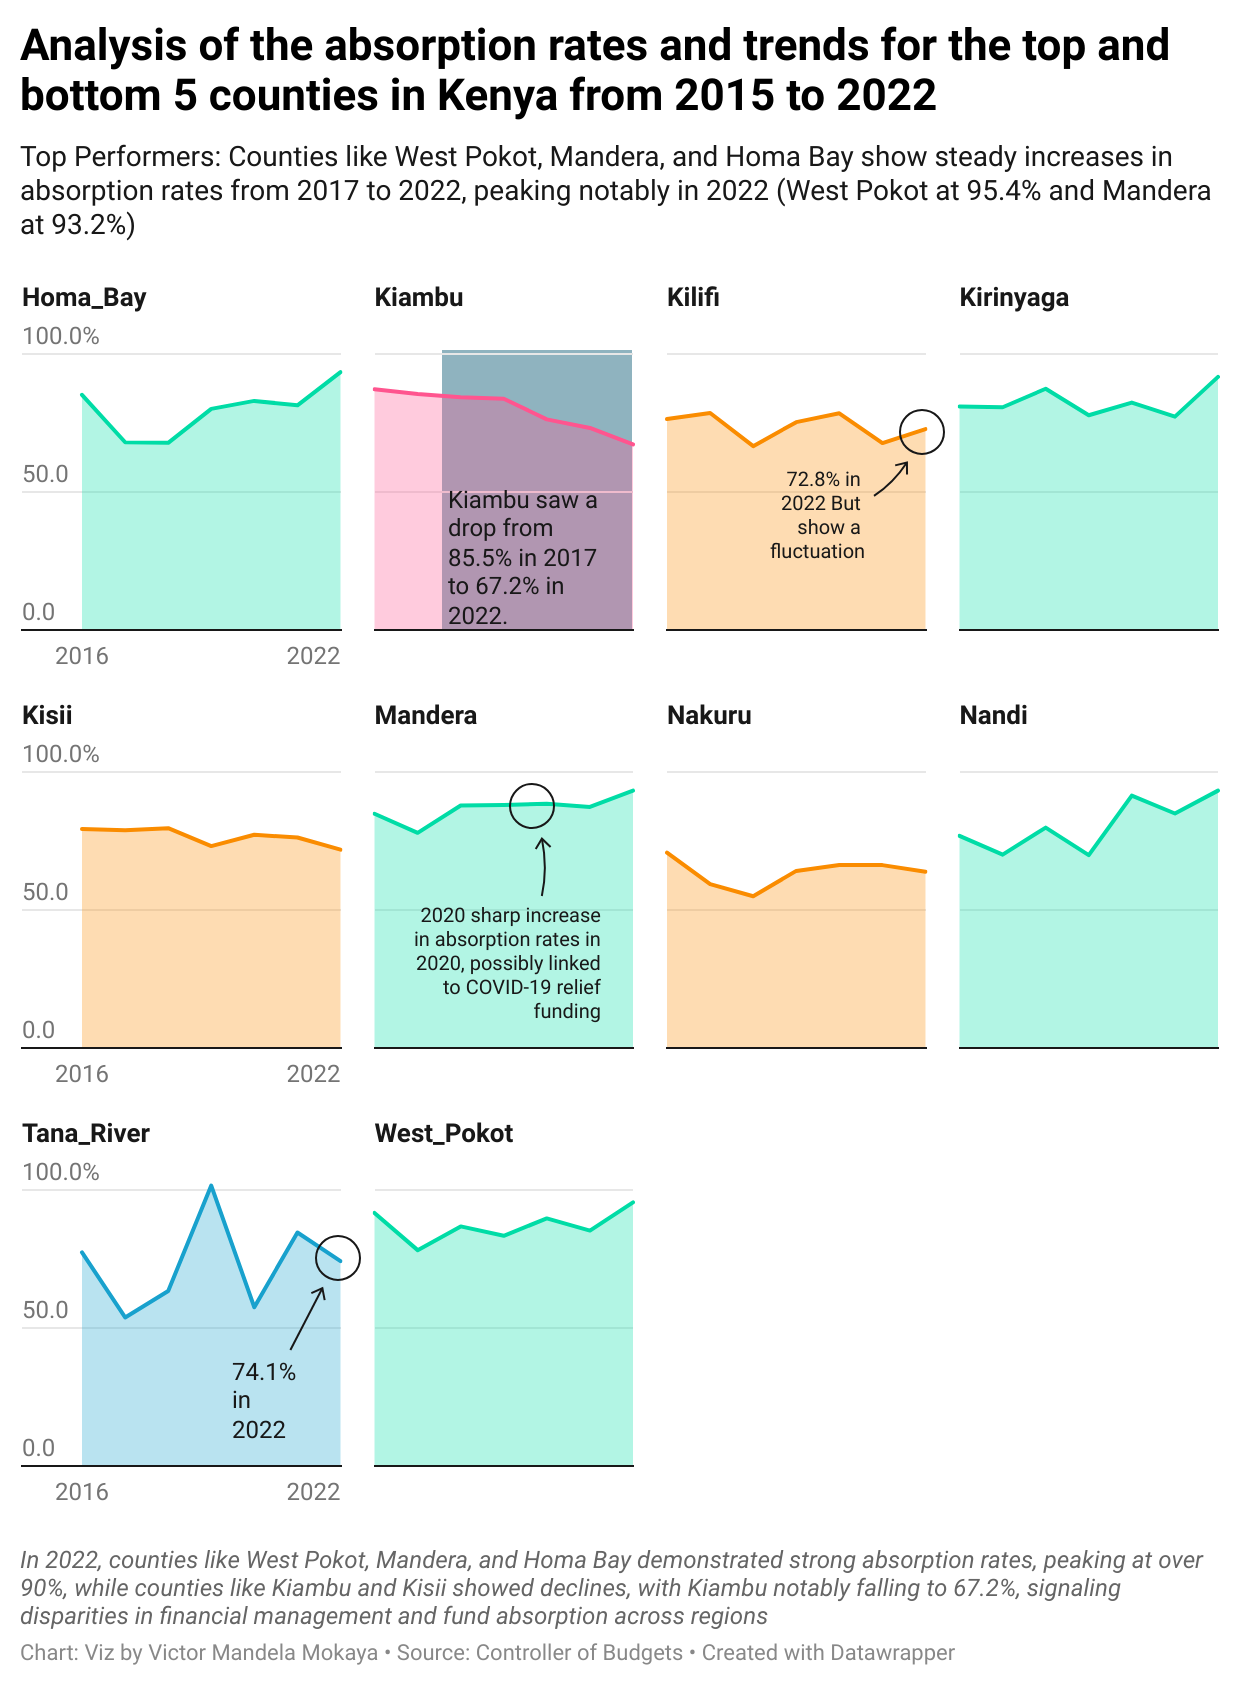
Monitoring & EvaluationMore ›
Understanding Absorption Rates and Their Implications in Kenya’s County Health Funding Monitoring & Evaluation

Understanding Absorption Rates and Their Implications in Kenya’s County Health Funding

In the context of Kenya’s healthcare sector, absorption rate refers to the percentage of allocated funds that a county effectively uses for its intended…

By Victor Mandela · 11 Nov 2024
  • Monitoring & Evaluation
    How to Develop a Research, Monitoring, and Evaluation Framework for Your Project
  • Monitoring & Evaluation
    How to Build a Monitoring Plan for Your Project
  • Monitoring & Evaluation
    How to Build an Evaluation Plan for Your Project
  • Monitoring & Evaluation
    DIGITAL BANKING SERVICES AND INVESTMENT DECISIONS OF FEMALE-OWNED SMALL AND MEDIUM ENTERPRISES IN NAIROBI CITY COUNTY, KENYA
No matching items
Health & DemographyMore ›
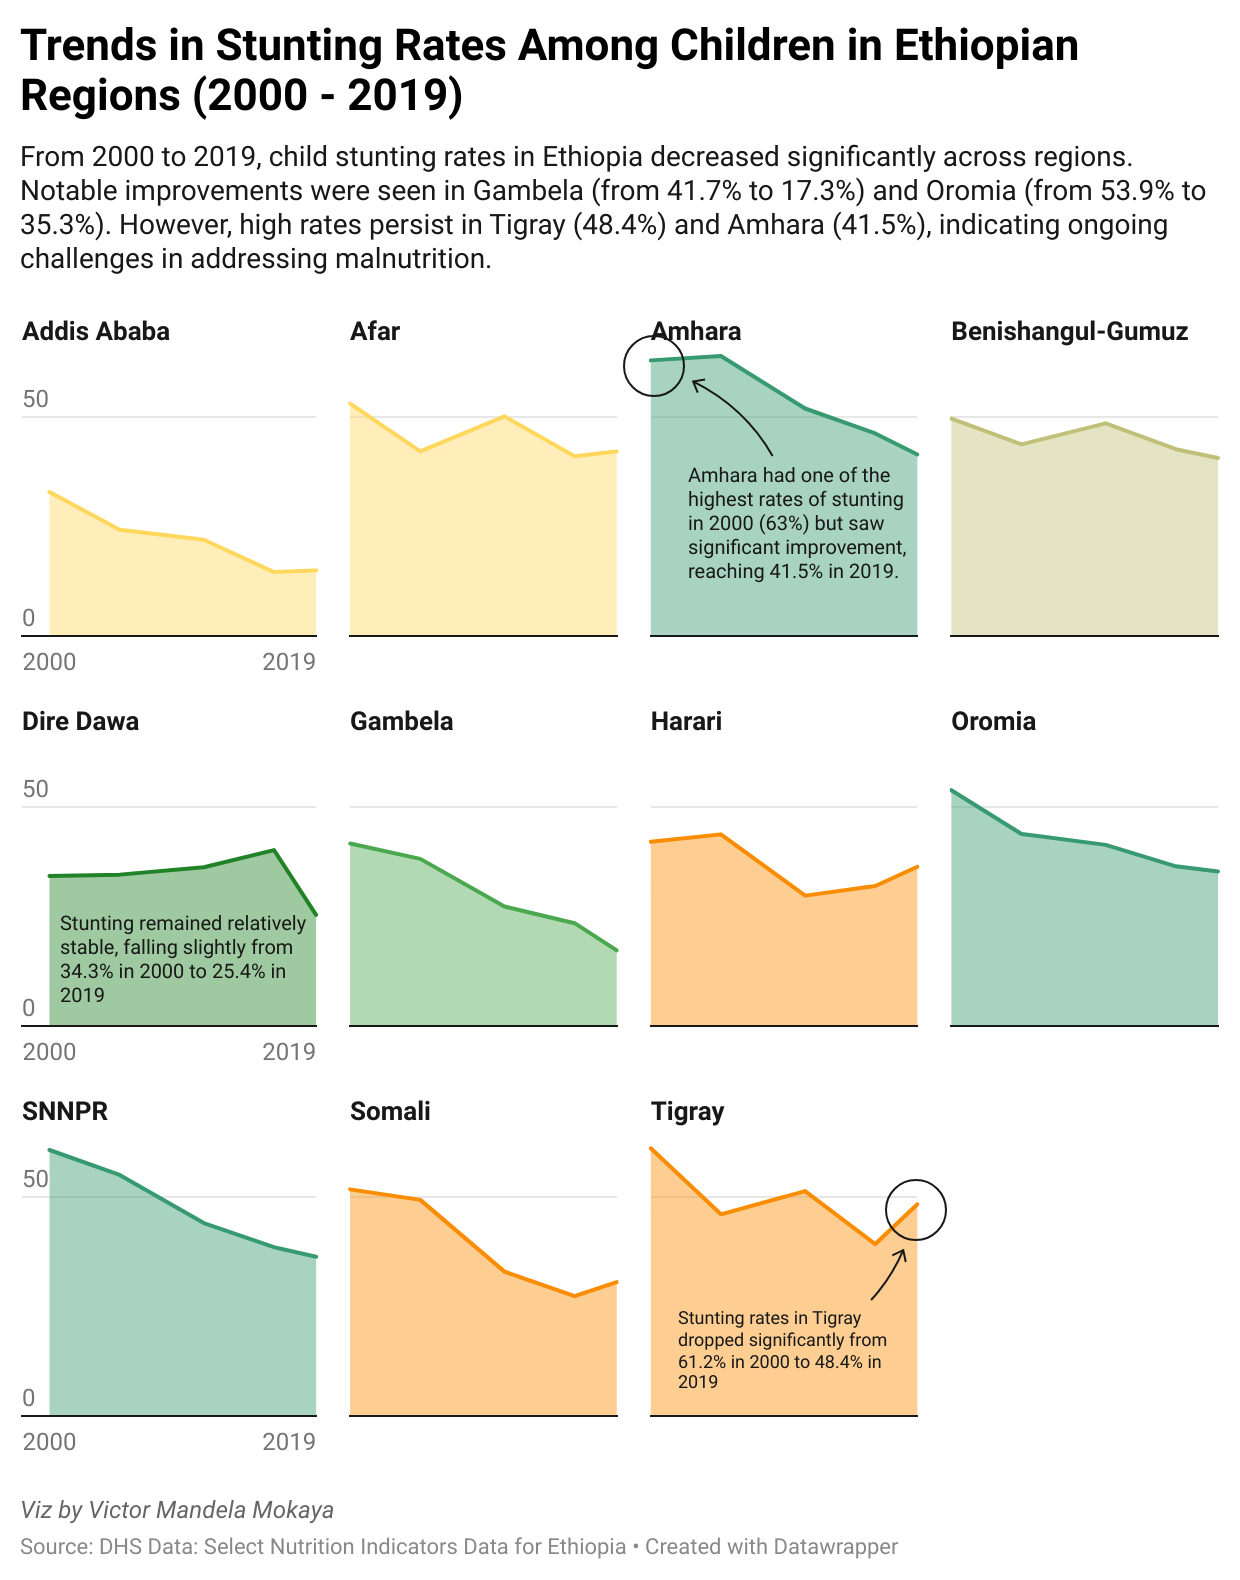
Understanding Child Stunting in Ethiopia: Trends, Impacts, and Future Directions: USING DHS DATA Health & Demography

Understanding Child Stunting in Ethiopia: Trends, Impacts, and Future Directions: USING DHS DATA

Ethiopia has made significant strides in improving child nutrition over the past two decades. However, child stunting remains a pressing issue, with many…

By Victor Mandela · 19 Oct 2024
  • Health & Demography
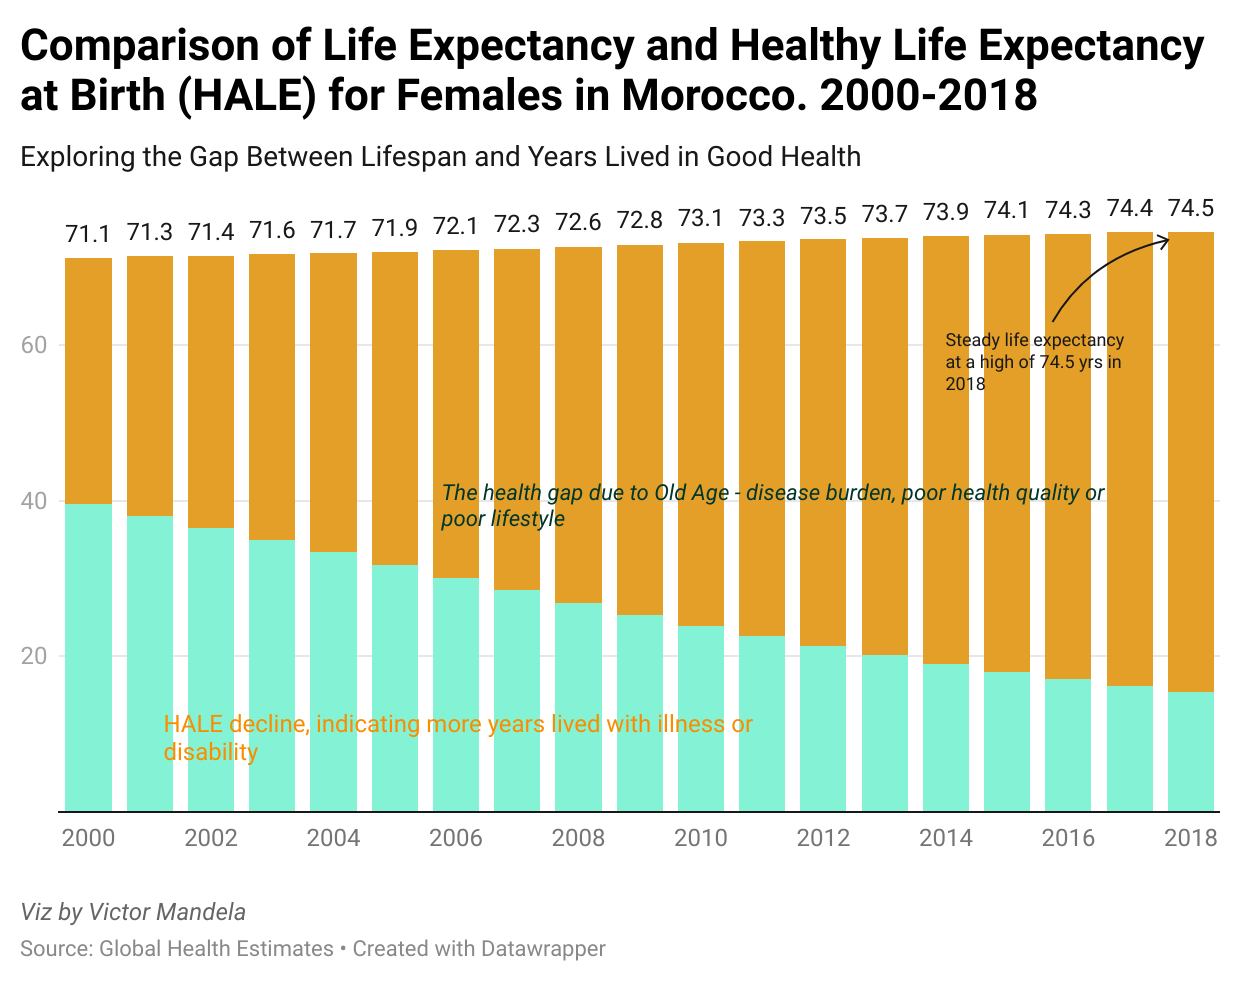
    Understanding Life Expectancy and Healthy Life Expectancy (HALE) in Morocco (2000-2018): USING DHS DATA
  • Health & Demography
    Monitoring and Evaluation in Health and Wellness: A Statistical Analysis Approach
  • Health & Demography
    Unlocking Insights: A Step-by-Step Guide to Calculating Multidimensional Poverty Index (MPI) Using SPSS
  • Health & Demography
    DHS data - Convert Column Values into Column Headers in R
No matching items
The editor's note
“Data has little value sitting in a spreadsheet. The value comes when it changes a decision.”

That is the test I hold every engagement to — whether it's an evaluation design, a monitoring framework or a dashboard. Read: from analysis to decision support ›

Surveys & Field DataMore ›
KoboToolbox Introduction to Computer assistes programming interface(CAPI) Surveys & Field Data

KoboToolbox Introduction to Computer assistes programming interface(CAPI)

In today’s world, collecting data efficiently is critical for research and decision-making. Whether you’re conducting surveys in remote areas or urban…

16 Oct 2024
Best Practices for Survey Design and Field Management Using KoboToolbox Surveys & Field Data

Best Practices for Survey Design and Field Management Using KoboToolbox

Creating well-structured surveys is key to collecting accurate and useful data. With KoboToolbox, you can design surveys that are easy for both…

16 Oct 2024
Data Quality, Analysis, and Case Studies Using KoboToolbox Surveys & Field Data

Data Quality, Analysis, and Case Studies Using KoboToolbox

One of the best features of KoboToolbox is its ability to automate quality checks during data collection. This ensures that the data you collect is clean…

16 Oct 2024
No matching items

GIS, Climate & SpatialMore ›
Integrating Citizen Science Data in Conservation GIS & Climate

Integrating Citizen Science Data in Conservation

Integrating citizen science data into conservation research: GIS, climate covariates and regression modelling in R.

By Victor Mandela · 19 Sept 2024
  • GIS & Climate
    Getting Weather Data via API with R
  • GIS & Climate
    Spartial regression: Lesson3
  • GIS & Climate
    Geospatial Data Manipulation in R: Lesson2
  • GIS & Climate
    Geospatial analysis with R: Lesson1
No matching items
Data Analysis & VisualisationMore ›
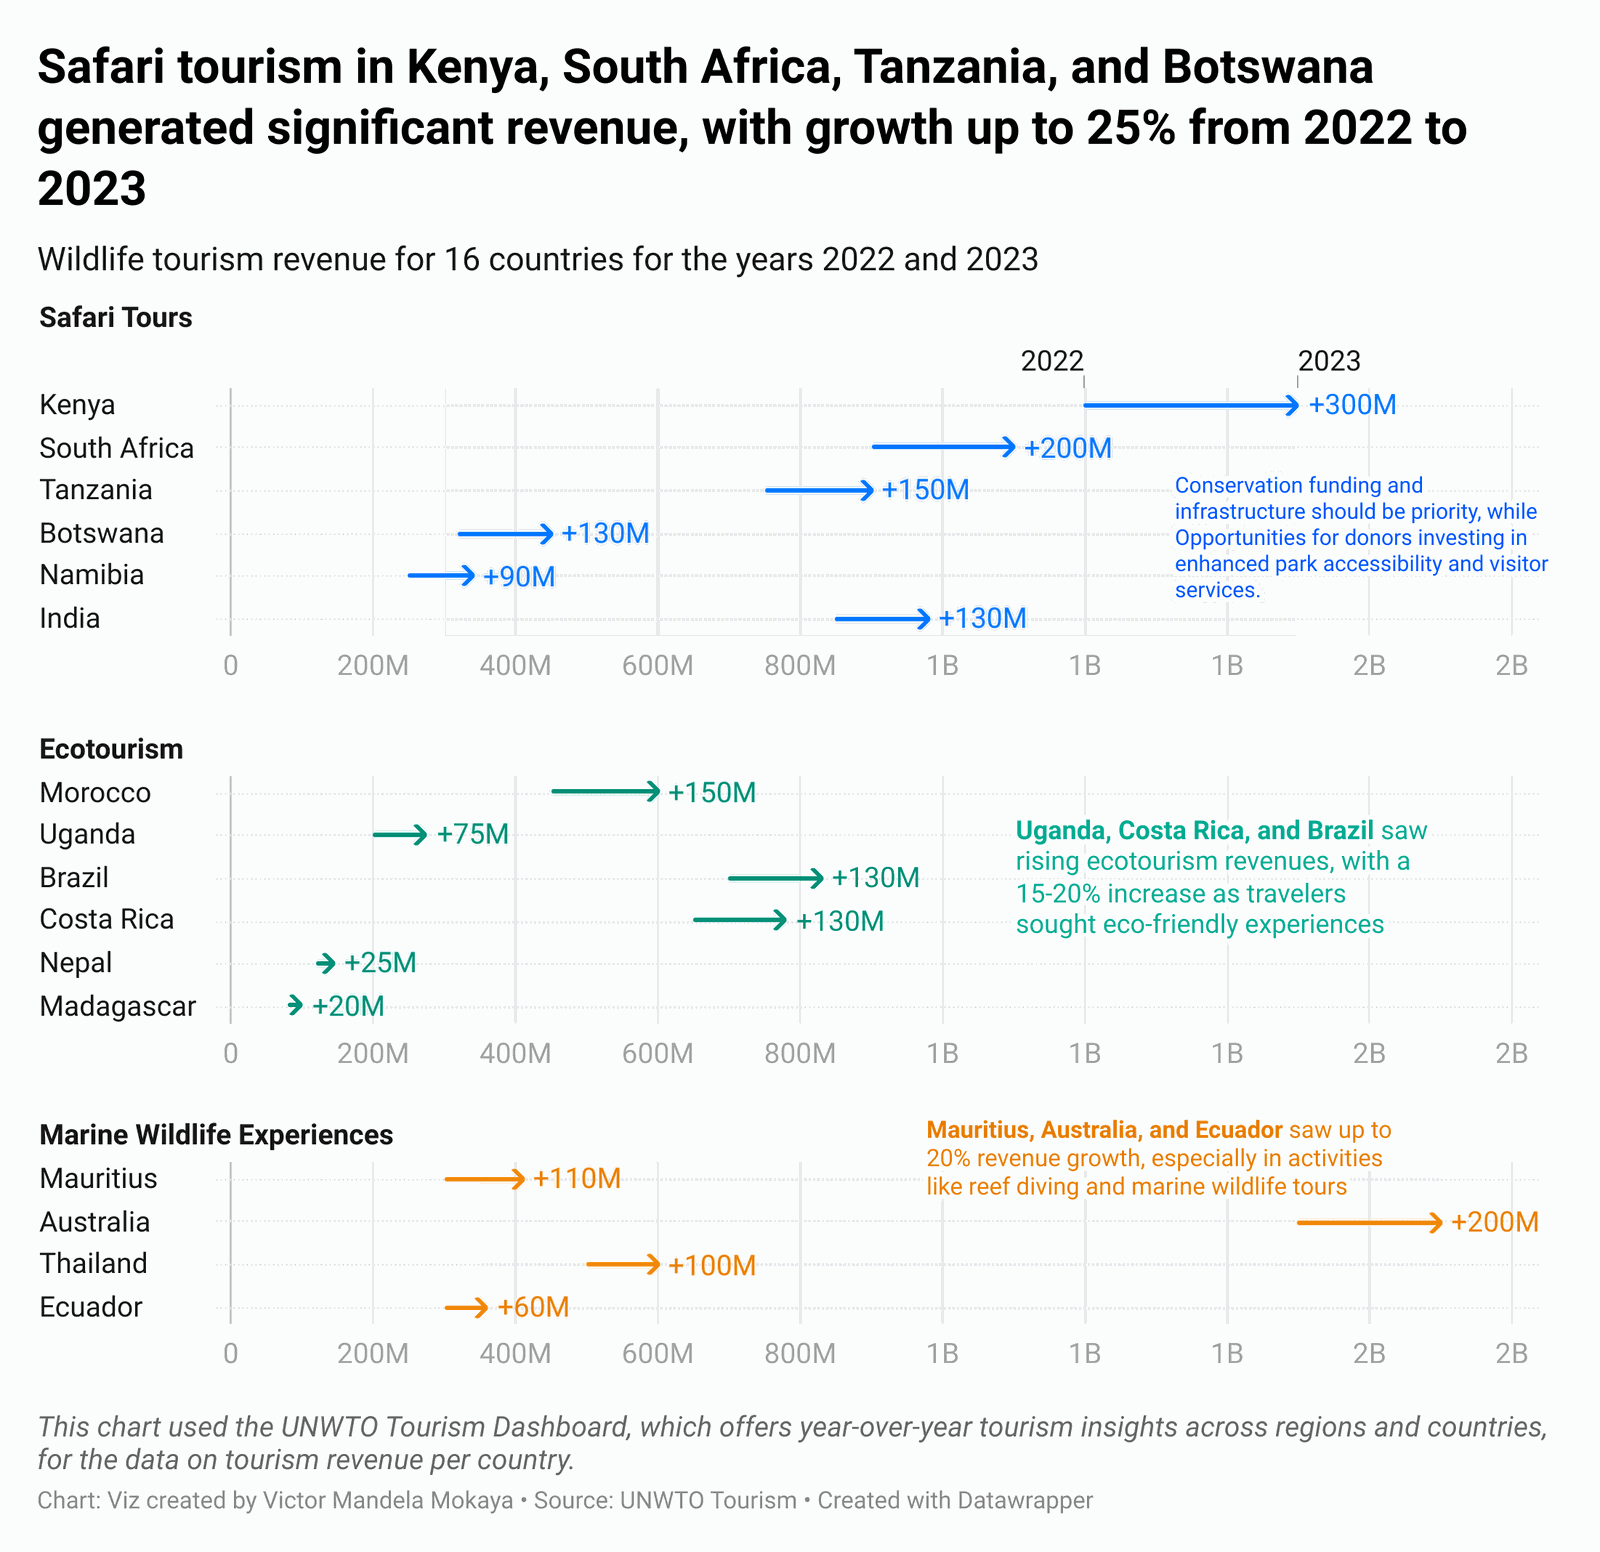
The Growing Importance of Wildlife Economy: A Path to Sustainable Growth Data Analysis

The Growing Importance of Wildlife Economy: A Path to Sustainable Growth

The global wildlife economy plays a crucial role in fostering sustainable development, preserving biodiversity, and providing economic benefits to local…

By Victor Mandela · 6 Nov 2024
  • Data Analysis
    Kenya Milk Export and Imports Analysis with R
  • Data Analysis
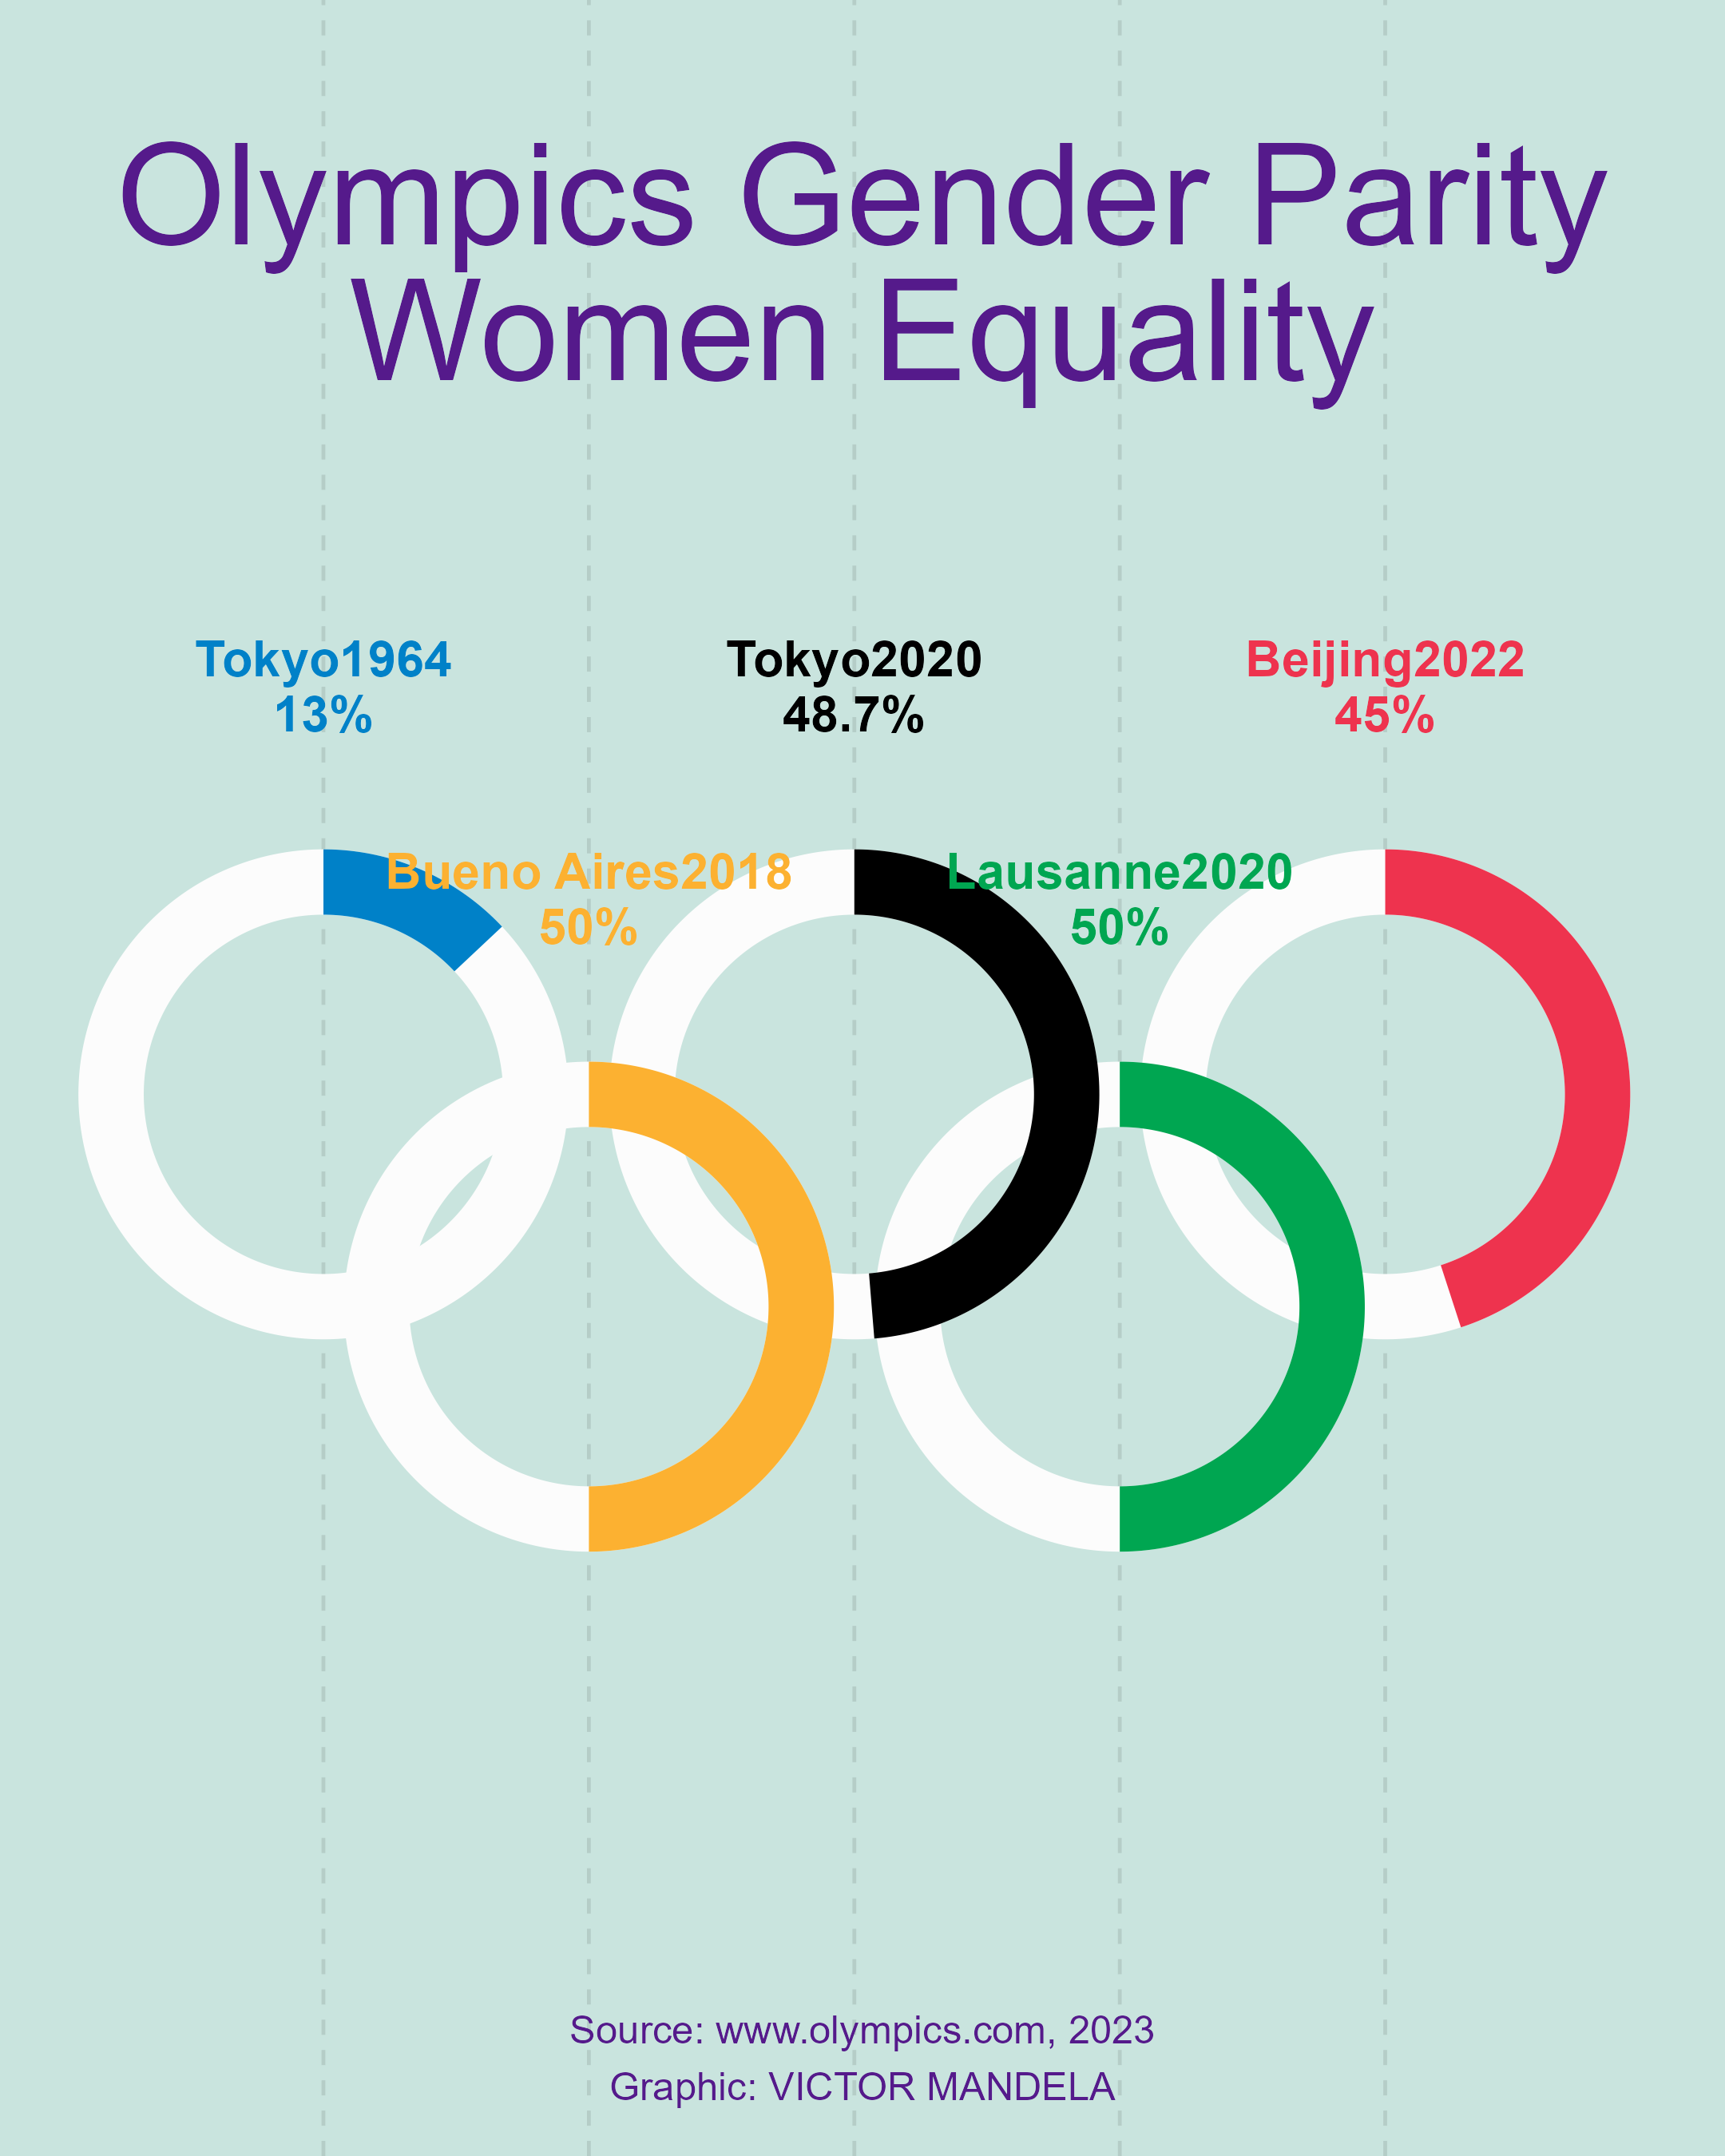
    Comparisons 01: Gender Equality Analysis Olympics
  • Data Analysis
    Potential causes of repetition and dropout in Primary Education covering Primary 1 (P1) to Primary 6 case study: Rural and Urban areas(P6)
  • Data Analysis
    Creating Beautiful Visualizations of Educational Attainment Using ggplot2 and ggbeeswarm
No matching items

Need a decision-support dashboard or an evaluation?

Free 15-minute discovery call · written proposal & quote · most dashboards delivered in 2–4 weeks with training and documentation.

Book a call See services
Work with me
  • R Shiny decision-support dashboards
  • M&E frameworks, plans & indicators
  • Impact evaluation & RCT design
  • Data integration (survey + GIS + climate)
  • Survey systems & enumerator training

DASHBOARDS FROM

$1,500

Typical delivery 2–4 weeks

Services & process ›
Latest dispatches
  • Maize Case Study · 25 Sept 2026From analysis to decision support: what this project changed
  • Maize Case Study · 23 Sept 2026Modularity is what lets an analysis survive its second request
  • Maize Case Study · 21 Sept 2026Would you give the same agricultural recommendation to every district?
  • Maize Case Study · 18 Sept 2026A dashboard should answer a question someone is stuck on
  • Maize Case Study · 16 Sept 2026Most teams don’t have a data shortage. They have a data integration problem.
  • Maize Case Study · 14 Sept 2026Mapping 600+ agricultural trial locations on one interactive map
No matching items
What clients say
Victor's dashboard transformed how we monitor our adolescent health programs. We saw a 40% reduction in reporting time.— ELMA EJAF grantee, M&E Director
The real-time food security data helped us target assistance to IPC 4 areas within 48 hours.— Lebanon Food Security Cluster Coordinator
Having live KPI tracking during our survey saved us 2 weeks of post-processing time.— CSV Research, Project Lead
Peer-reviewed research

Scientific Reports (Nature Portfolio), 2025.

Read the article ›
Topics index
Statistics21R16Analysis12Monitoring and Evaluation11Case Study10Survey9Visualization9GIS7Data Collection6CAPI6Agricultural Analytics6R Shiny5Soft Skills3SurveyCTO3KoboToolbox3DemographicHealthSurvey3
Toolkit
RShinytidyverseQuartoLeaflet / sfSPSSKoboToolboxSurveyCTOODKDHIS2Generative AI

Evidence & Impact ReviewEdited by Victor Mandela · Nairobi, Kenya

Monitoring, evaluation and data science consultant based in Nairobi, Kenya. I turn research and programme data into R Shiny decision-support tools that teams actually use.

vmandela99@gmail.com · Book a 15-min call

Live demos
  • Rwanda Maize Yield Analyzer
  • Analytics Monitoring
  • ELMA EJAF Adolescent Health
  • FSN Lebanon 2024
  • All dashboards ›
Desks
  • Maize Case Study
  • Monitoring & Evaluation
  • Surveys & Field Data
  • GIS & Climate
  • All dispatches ›
Work with me
  • Services & rates
  • About / profile
  • Training & courses
  • LinkedIn
  • GitHub
© 2026 The Evidence & Impact Review · Victor Mandela Mokaya · Nairobi, Kenya