
That was one of the objectives of the maize yield project I recently worked on.
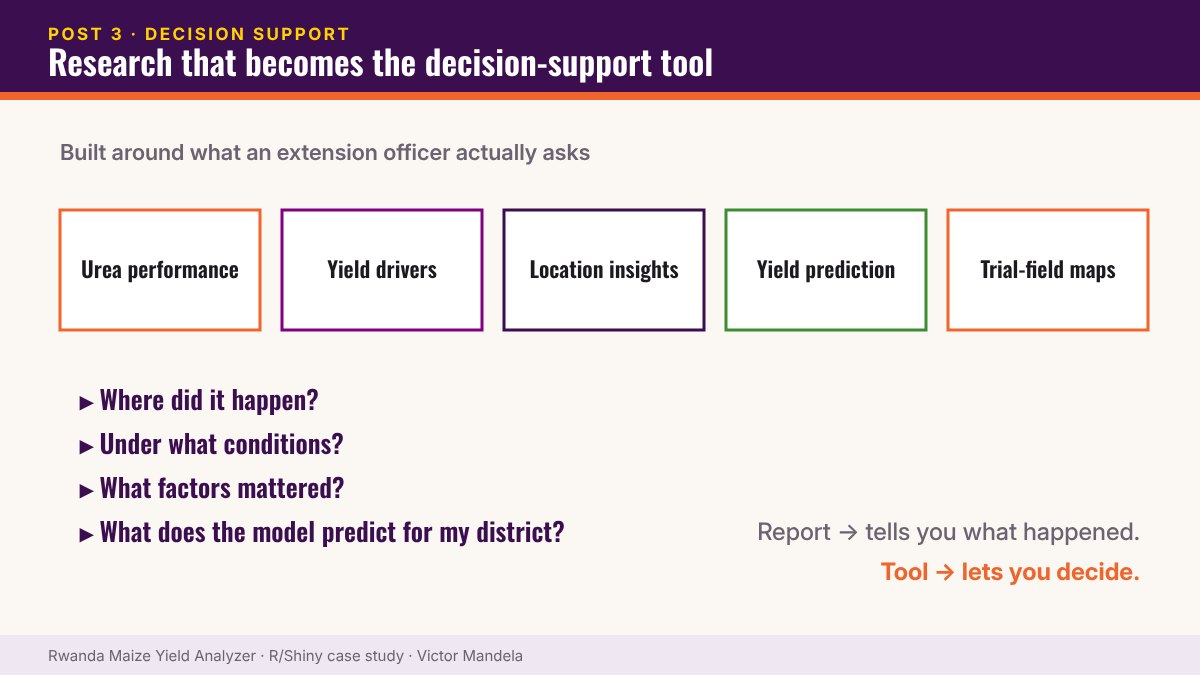
The goal wasn’t to produce statistical tables. It was an interactive Shiny application built around what an extension officer would actually ask.
What it brings together
- Urea performance analysis
- Yield-driver analysis
- Location-specific insights
- Yield prediction
- Interactive trial-field maps
Report vs. decision tool
A research report tells you what happened. A decision-support application lets someone ask:
- Where did it happen?
- Under what conditions?
- What factors mattered?
- What does the model predict for my district?
That’s the direction I see for M&E and agricultural analytics: moving from reporting data to building tools people decide with.
▶ Try it yourself — live R Shiny demo. Open the Rwanda Maize Yield Analyzer · Username: test · Password: test
Part 3 of 10 — The Maize Yield Case Study. Read the full case study and launch the dashboard › · Work with me on a similar project ›