
I explored this with a linear model:
Yield ~ Soil pH + Nitrogen + Treatment + District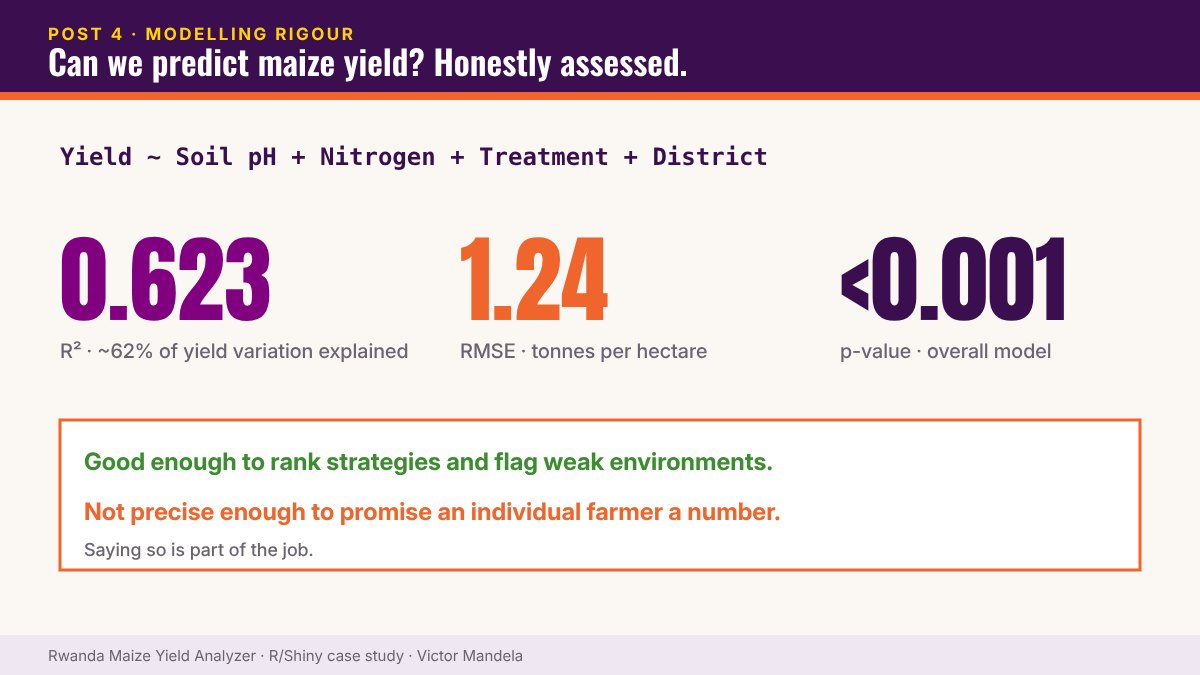
The results
- R² = 0.623 — explains about 62% of yield variation
- RMSE = 1.24 t/ha
- Overall model significant at p < 0.001
The important part
A statistically significant p-value doesn’t automatically make a model a good prediction tool. You still have to ask:
- How much variation is left unexplained?
- How large are the errors relative to the decision?
- Where does it perform well or poorly?
- Would anyone actually decide differently because of it?
An RMSE of 1.24 t/ha is good enough to rank strategies and flag weak environments. It is not precise enough to promise an individual farmer a number. Saying so is part of the job.
▶ Try it yourself — live R Shiny demo. Open the Rwanda Maize Yield Analyzer · Username: test · Password: test
Part 4 of 10 — The Maize Yield Case Study. Read the full case study and launch the dashboard › · Work with me on a similar project ›