
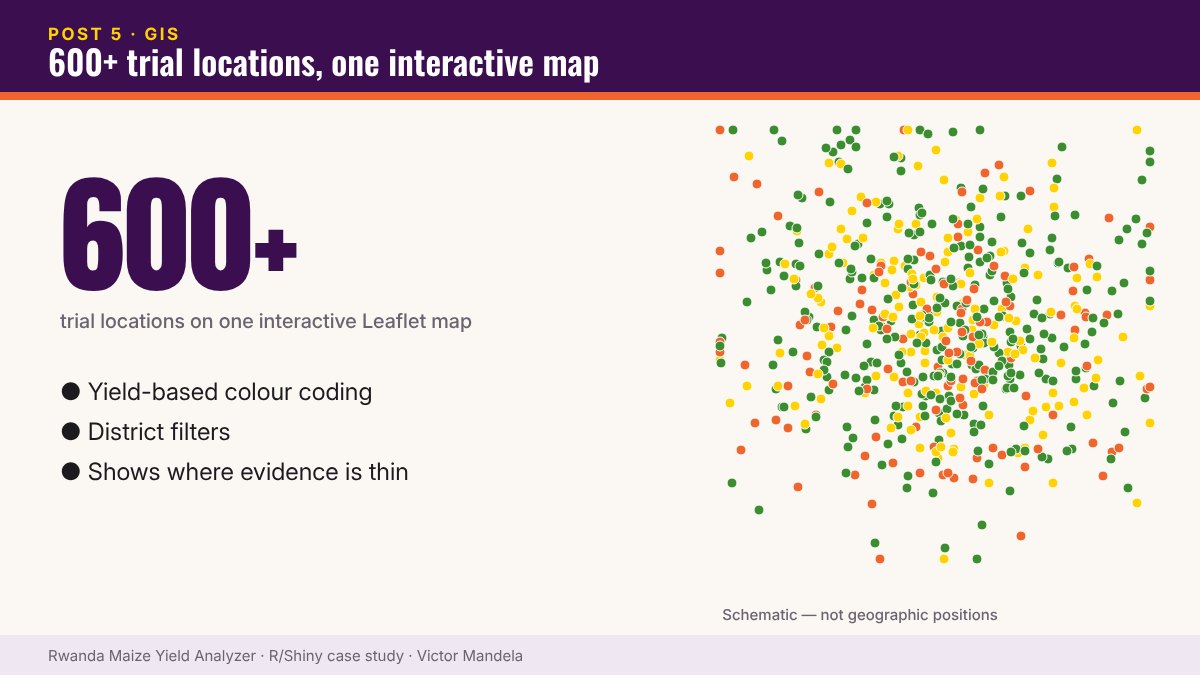
The maize yield Shiny application includes a Leaflet map showing:
- Geographic trial locations
- Yield-based colour coding
- District filters
Why does this matter?
Agricultural data is rarely just about what happened. It’s also about where. Two farmers can apply the same treatment and get very different results because of soil, rainfall, location and agro-ecological environment.
Collapse all of that into a national average and the variation isn’t resolved — it’s hidden.
An underrated benefit
A map shows you very quickly where your evidence actually is — and where you’re extrapolating from thin coverage.
This is why I keep combining Statistics + GIS + R + Shiny.
▶ Try it yourself — live R Shiny demo. Open the Rwanda Maize Yield Analyzer · Username: test · Password: test
Part 5 of 10 — The Maize Yield Case Study. Read the full case study and launch the dashboard › · Work with me on a similar project ›