
For the maize yield project, I designed the Shiny application around four analytical questions:
- Which urea treatment performed best?
- What factors are driving maize yield?
- Can yield be predicted?
- Where were the trials, and how did yields vary spatially?
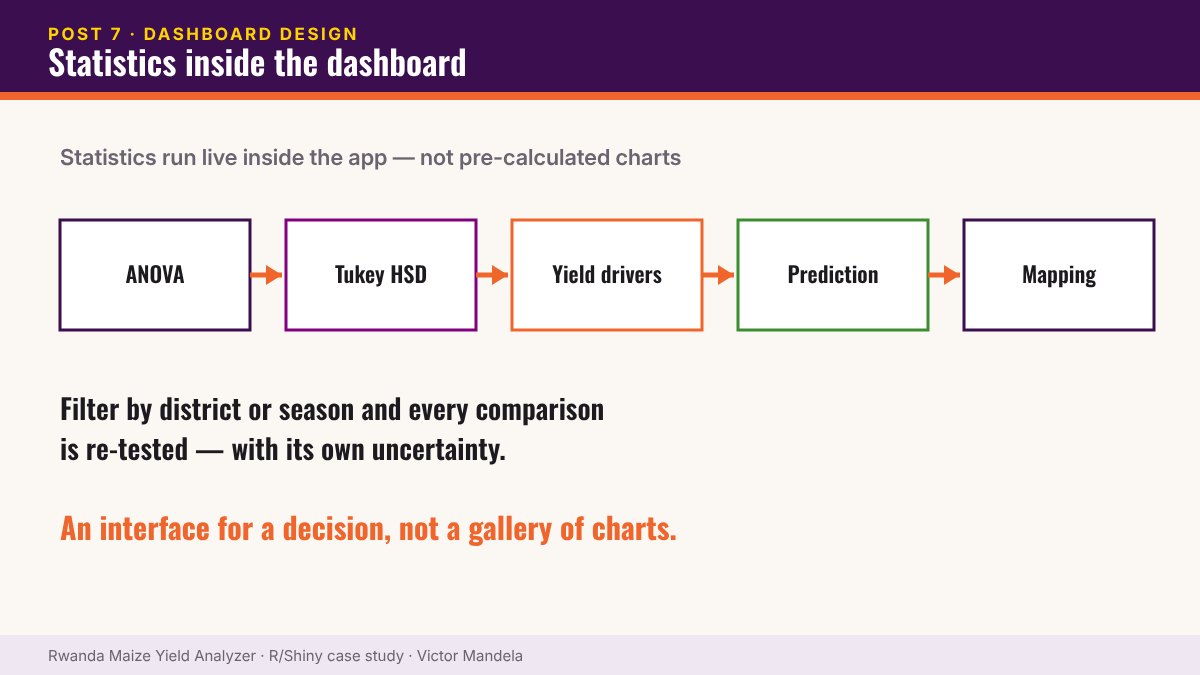
This meant embedding actual statistical analysis inside the application, not just displaying pre-calculated charts.
Workflow: ANOVA → Tukey HSD → Yield drivers → Prediction → Interactive mapping
The difference shows the moment a user filters
If the statistics are live, a filtered comparison is still a valid comparison — with its own test and its own uncertainty. If they’re pre-calculated, filtering produces something that looks like analysis but isn’t one.
A good dashboard is an interface for a decision, not a gallery of charts.
▶ Try it yourself — live R Shiny demo. Open the Rwanda Maize Yield Analyzer · Username: test · Password: test
Part 7 of 10 — The Maize Yield Case Study. Read the full case study and launch the dashboard › · Work with me on a similar project ›