
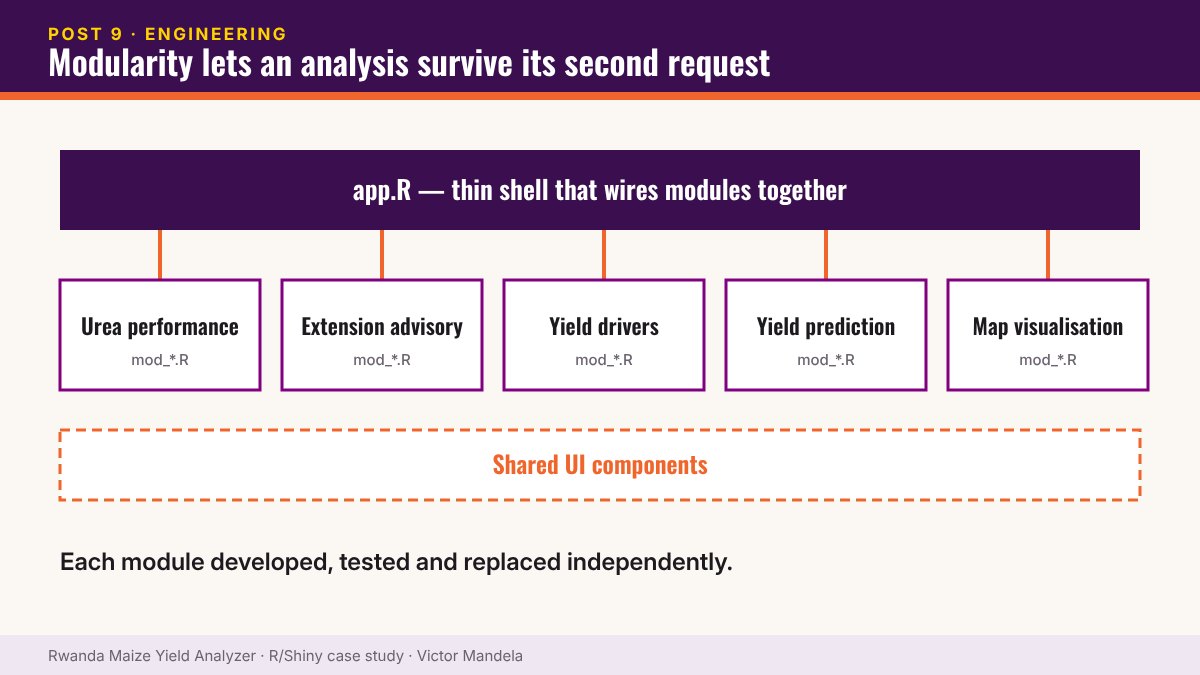
Instead of one large Shiny script, I structured the application into modules:
- Urea performance
- Extension advisory
- Yield drivers
- Yield prediction
- Map visualisation
- Shared UI components
Analytical applications grow — predictably
A project starts with one chart. Then: “Can we filter by district?” “Can we add rainfall?” “Can we predict yield?” “Can we map the trials?” “Can users download results?”
In a monolithic script, every one of those raises the chance of breaking something unrelated — and the fear of breaking things is what eventually stops the tool being improved at all.
With modules, components can be developed, tested and replaced independently. The objective isn’t just to produce an analysis. It’s to build something still being used a year later.
▶ Try it yourself — live R Shiny demo. Open the Rwanda Maize Yield Analyzer · Username: test · Password: test
Part 9 of 10 — The Maize Yield Case Study. Read the full case study and launch the dashboard › · Work with me on a similar project ›