
The starting point was straightforward: how does maize yield respond to urea fertiliser?
Answering it properly required much more than averages. We had to bring together experimental field data, soil information (SoilGrids), rainfall data (CHIRPS), statistical testing, predictive modelling, GIS and R/Shiny — and turn all of it into a single decision-support application.
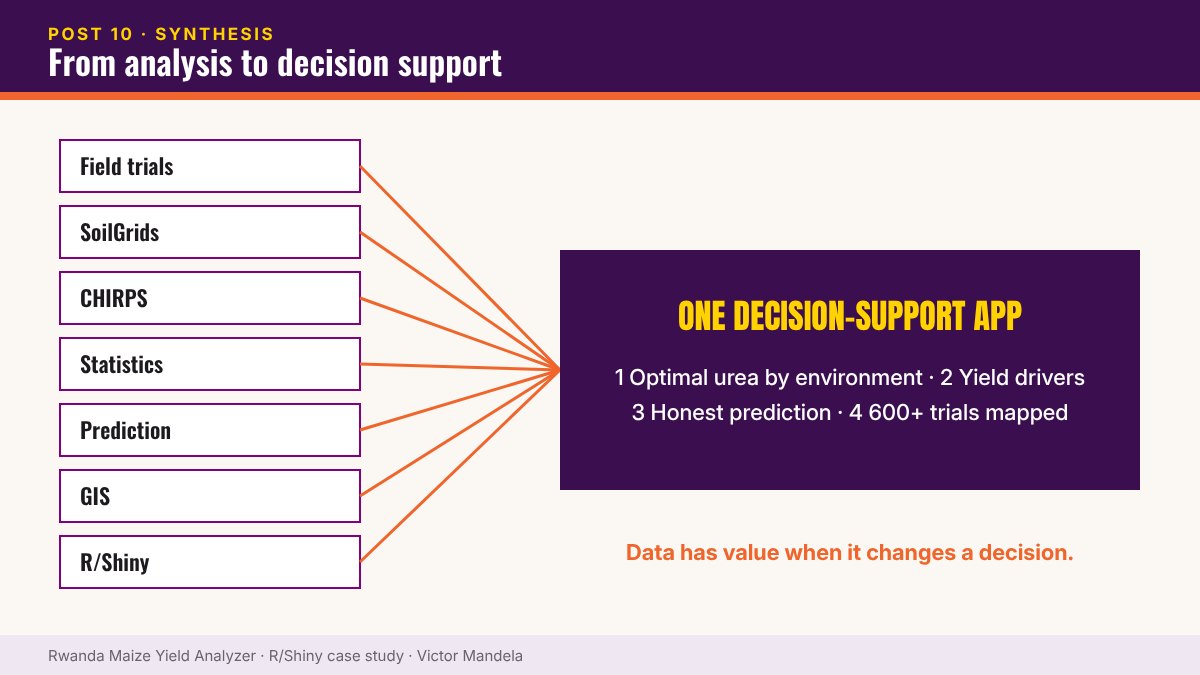
Four objectives
- Identify optimal urea rate/timing combinations by environment
- Identify yield drivers and provide extension insights
- Build and honestly assess a yield prediction model
- Visualise 600+ trial locations
This is the kind of work I want to keep doing — turning complex research and programme data into tools people actually use.
Data has little value sitting in a spreadsheet. The value comes when it changes a decision.
Work with me
I take on consulting work in agricultural analytics, impact evaluation and M&E — RCT design, data integration, and R/Shiny decision-support tools. Let’s talk if that’s useful to your team.
▶ Try it yourself — live R Shiny demo. Open the Rwanda Maize Yield Analyzer · Username: test · Password: test
Part 10 of 10 — The Maize Yield Case Study. Read the full case study and launch the dashboard › · Work with me on a similar project ›